Dr. Ama Nyame-Mensah, an expert in data storytelling and visualization, discusses the problem of oversimplification in data visualization in this episode. She explains how this issue can occur during data aggregation, visualization selection, and a lack of artistic expression. Emphasizing critical thinking, she advocates for a balance between complexity and accessibility, using interactivity and storytelling to engage audiences.
Key Takeaways
- Question everything and seek clarification when consuming data visualizations.
- Read the fine print, including annotations, notes, and data sources, to gain a deeper understanding.
- Take a holistic approach to data visualization, incorporating different mediums and techniques to create immersive experiences.
- Creating inclusive work environments involves fostering a sense of belonging, providing equal opportunities, and promoting diverse voices and perspectives.
- Diversity and inclusion are crucial for the success and innovation of the tech industry.
Chapters
00:00 Introduction and Background
03:07 The Problem of Oversimplification
06:34 Three Ways to Oversimplify Data Visualization
21:32 The Role of Artistic Expression in Data Visualization
29:12 Balancing Complexity and Accessibility
38:57 Taking a Holistic Approach to Data Visualization
46:09 The Immersive Experience of Data Visualization
48:41 Eliciting Emotion and Evoking a Journey
48:54 Conclusion and Contact Information
What you can do:
By embracing critical thinking and a holistic approach to data visualization, you can avoid oversimplification and create more impactful presentations. Prioritize diversity and inclusion in your organization by addressing bias, fostering inclusive environments, and measuring the success of these initiatives to drive meaningful change.
Resources:
- Ama’s Blog
- Work with Ama to create compelling charts and build workflows that tidy up data for analysis with one click.
- Read Ama’s article, When Oversimplification Obscures, in Nightingale.
Read an auto-generated transcript of the Episode:
Alexandra Mannerings (00:17)
Our guest, Ama Nyame Mensah, takes us on an incredible journey of exploring all of our assumptions of what we think makes data visualization good. And she challenges us and pushes us to say, maybe these best practices that have been recommended to us for a lot of time, like the idea that you’re supposed to make it as simple as possible, maybe not. Maybe making it simple.
actually obscures the real story that that data is there to tell. So please join me in opening your mind and learning how to question everything as we explore really the power of data storytelling with Ama Nyama Mensah who is going to take us on a data storytelling journey.
Alexandra Mannerings (01:03)
Thank you so much for joining me today. I am so excited to have you today, Amma, and I was hoping you could start by introducing yourself and how you came to the data space.
Dr. Ama Nyame-Mensah (01:12)
Sure, thank you so much for having me. This is such a treat. So my name is Ama Nyame Mensah. I am a speaker, a data storyteller, a researcher, and I’m also the founder of my own business, which is Analytics Made Accessible. And so just to give you a little background about how I came to data. So I had a really early interest, I would say, in data and programming.
One of my earliest memories is sitting in my dad’s lab and him actually like being on one of those old computers and teaching me how to like insert data into his spreadsheet. So I don’t think it’s too far of a stretch to figure that I would land doing the work that I’m currently doing. And so after sort of, I guess, nurturing some of that early interest, I went on to do more of what I would call like social and behavioral science research. And so…
Within that work, I was particularly interested in looking at processes of marginalization, exclusion, but even in studying those types of topics, I was always really interested in this notion of how data can be used to liberate or imprison us. And so that’s actually what led me to do my PhD in social welfare. And I got to fuse all of my interests together.
was able to look at the influence of data and data technologies. I was also to specifically look at how different types of ways that we collect data can influence child development. So it really all around was just a great way for me to incorporate all of my interests together. And so now what I do is I partner with organizations and leaders who are really focused on learning how to create compelling charts and narratives.
and are passionate about sharing different types of data stories that matter. And sometimes that really falls on the side of more of like the visual. Other times it’s really helping people come through and creating processes for actually just dealing with their data. So that could be collecting data, analyzing data, reporting data.
Alexandra Mannerings (03:00)
Yes, and I love with your new organization, right, analytics made accessible, the idea is continuing to open that door, right, continuing to allow data to be used in a way that liberates and does not imprison. So I love that. And I know we got connected because I stumbled across this amazing article that you wrote for Nightingale about an interesting contradiction, I will say, in analytics, which I’m very excited to talk with you about today and we’ll link to the article, everyone should read it. So be in the show notes to read this article.
But if we start with this idea, right, so you wrote this article about when oversimplification obscures, which I love the title to start with, but what led you to even think about that as a problem, to identify that in how we use data visualization?
Dr. Ama Nyame-Mensah (03:42)
So thank you for reading the article. I always say this to folks that it’s kind of funny. So that article actually started off as a rant. I was just mulling over these ideas about data and data analysis and data visualization. And I should say, I actually came to data visualization after having gone through this process of being just more centrally interested in data science and data analysis and being frustrated with the fact that
You could have these really cool analyses, but no one would read them. No one would look at it, right? And so I said to myself, well, surely there has to be something that we can do in the reporting process and the visualization process to really help people use data and be excited by data, and to be moved by data. And so that’s actually how I fell into data visualization. And so this article was really, as I said, born out of this internal monologue that I’ve been having with myself for years about
What is the purpose of data visualization? And more importantly, should we care how simple or simplistic our graphics and visualization types are? And one of the things that’s really stuck with me as I’ve been mulling over some of these topics is how we even define data analysis and data visualization.
And for a lot of folks, it really is thought of as this process of, you know, either applying statistical or logical techniques to describe, or in the case of visualization, to illustrate, right? and condense and recap and evaluate data. And those are so reductive to me. It’s like, you’re telling someone to take this infinite number of, of understandings and experiences and then whittle it down to something that’s super simple and.
I think on the surface that sounds really great, right? Like when we have a whole lot of data and we wanna just really pick out some interesting insights, it seems advantageous, right? To sort of distill those things down. But then I asked myself, well, what do we lose in the process? Like what actually happens when designers make things that are really complex appear simple? And in my piece,
What I hope I did well and was transmitted through the actual written piece is that I’m taking readers on this journey of what I see is this problem of oversimplification. Because I think in some respects, when you’re analyzing data or when you’re applying some sort of data visualization technique, you’re always going to be simplifying something. But it’s when you oversimplify to the point where you’re making and you’re transmitting something that…
has lost its value and it makes people feel as though something is a lot more simple or direct, you’re losing something in translation. And so what I do is I use three case studies to sort of share with folks some of the things that I’ve been wrestling with in different ways that I see that both
folks who sort of play in this data space more broadly and in particular in data visualization, so data designers, information designers, three ways that you can oversimplify your different types of designs that you’re actually creating.
Alexandra Mannerings (06:44)
And I’d love to talk about that a little bit more, you know, in these three examples, because I do love all three of them that you have in there, because you bring up, I think, something that we don’t talk about. There is so much of a push of like, use the right colors to call out exactly the one data point people are supposed to look at. You know, all these, like you said.
activities that are trying to get at what’s the one thing we’re supposed to know, but sometimes there’s more than one thing we need to be able to hold in our head at the same time. And so what are some of these dangers of truly oversimplifying? Because I think some data visualization practitioners would not recognize that oversimplification is even possible. So if we think about like, why is this something we should be concerned about doing?
Dr. Ama Nyame-Mensah (07:21)
So yeah, so, and that’s actually also why I wanted to take a more case study approach because like you said, oftentimes a lot of folks like to throw out, well, this is the best practice, but then when you sort of probe and question and then, how did it come to be a best practice, right? And so I wanted to really give three concrete examples of ways that oversimplification could really seep into the design process.
and I wanted to be really thoughtful about it, not just being the end result, because oftentimes when we think about data visualization, folks are coming into it after having collected the data, after having analyzed the data. And I always tell folks and even clients that I work with, no, like call the person who’s going to actually be working with you and collaborating with you.
before you collect your data, because we can really help you tune into some of the things that will then go on to impact your analysis, to impact how it is you actually want to visualize your information. And so within the piece, the first type, or the first way in which you can oversimplify your data, actually comes before you visualize. And that’s in this data aggregation phase, is I think what I call it. And so data aggregation is really
expressing data in a summary form. And so it is reductive in a way, right? We’re trying to form different groups, right? And you’re making choices about what types of data elements are going to be included, excluded, emphasized, removed altogether, right? And so as I said, this is, you know, data aggregation is something that occurs.
typically before a designer actually gained access to a data set. And so oftentimes we’re inheriting all of these choices that someone else has made and may or may not have actually communicated them to us. And so increasingly data visualization designers, folks who are creating these types of infographics, and other types of designs, we are the ones who are being tasked with cleaning and preparing data sets. And so I find that we also really need to be tuned into understanding
What are the opportunity costs of making some of these choices? What are we giving up? What is it that we’re imbuing into the data? What are some of the choices that are already there as a consequence of having collected certain types of data, asking questions to even be able to collect the data? And so what I talk about in the piece is I say that aggregation can make data easier to analyze, because when you have, let’s say, millions of data points,
and you want to ask a very specific question, you need to be able to distill it down.
So in the piece, I talk about how if we’re thoughtful about how we aggregate, it can make data easier to understand. And I said, I said, when we have millions of data points, oftentimes we want to be able to say something meaningful, but we can’t do it necessarily in an easy way with all million data points. And so we find ways to aggregate the data to see how can they be grouped, how can we express it in a way that doesn’t misrepresent the data, right?
This allows us to come away with something very meaningful. And so we need to approach that process, though, with care. Because if we don’t, we can find ourselves in a situation where we actually limit our ability to actually make sense of the data. And so in the piece, I believe I give the example, and it’s one that’s sort of overdone, but it’s also part of the reason why I did it. In a lot of Western societies, we’re really interested in this notion of who’s a minority, who’s not a minority, who’s marginalized, who’s not marginalized.
And so oftentimes in that process, what we end up doing is aggregating and grouping everyone oftentimes who is not white into this other category. And while on a sample size sort of thought process or line of thinking that can be helpful, but from a descriptive point of view, from an analytical point of view, it actually really limits your ability to say something about all the folks who are in that other category. And oftentimes,
I’ve seen visualizations where they don’t even tell you who’s in that category. They’re just like non-white and I’m like, okay, there’s so many groups out there. Like who is it? And I think oftentimes even when we categorize in that way, I often have myself asking this question, well, who’s in the white category? Like, what do you mean by white? so this is one way that if we’re not thoughtful and we’re creating these higher order groupings that we’re hiding.
right, who’s in these categories. And we need to be thoughtful about expressing and representing the experiences and outcomes of those folks in those groups. So that’s one way. So data aggregation is the first way. Another way that you can oversimplify a visualization is if you’re not really selective in when you’re choosing your visualization time. And I realized when I wrote the piece, I was speaking directly to folks
who weren’t being selective with chart choice. But I actually would take a step back and say that this is a challenge all designers face. And I would even go a step further and say that it’s a problem that happens even when you’re choosing to actually create a visualization. Like, should you visualize or not? Right, that’s a question that I asked myself. And it’s something that when I talk about with other practitioners,
I don’t find a lot of folks are even asking that first question, should we even visualize, right? And so if you do make the decision to visualize and you’re running through some of the different selections and choices that might work for a data set, you really need to be careful in thinking about how the specific chart or visualization type that you’re using might actually influence how your audience perceives the data that are being represented in, let’s say, for example, a chart.
The example I give in the article of, and it’s interesting when I was coming up with this example, a colleague of mine, I didn’t know at the time, was actually writing a piece in a similar vein to mine and had actually published on some work around how audiences’ members’ sort of perceptions are actually influenced by different chart choices. So I was able to actually draw on the article that they had published with their colleague.
And in particular, they were really interested in this notion of how participants can attribute differences. And I think in particular, this was social outcomes to personal characteristics versus society at large when presented with a visualization that hides versus shows variability. And so really all that means is, and I sort of boiled this down and distilled this down, no pun intended to simplifying, in the piece.
I give an example and show the difference between looking at the average of scores for a fictitious school, I think, using bar graphs and comparing, if you will, the average reading scores, I think it was for black and white students in a fictitious sort of school district, versus actually showing the variation for every student within that district using something like a jitter, a jitter plot.
And really what you see is a completely different picture. Because with a bar graph, you’re really only resigned to seeing the length of the bar and where that bar ends. And you’re really, really focused on the length of the bar and looking at the number at the axis. And that’s really all you focus on. in the piece, it’s clear that, and I did this on purpose to make this point, that oftentimes when we think about, let’s say, reading in a context like the United States,
What’s typically focused on is the fact that black students do worse than, let’s say, white students when it comes to reading scores. And so that then becomes the narrative. But what’s missed in that narrative when we use a bar chart versus something like a jitter plot is just the sheer variation in scores for students who are taking these types of standardized tests. And that’s something that you can see with a jitter plot. And so that then begins to raise different types of questions. Well, some students from one group did better than others. Well, what’s going on? And we might even.
begin to raise other questions about, well, what’s going on if you’re seeing clusters for students at a particular school, right? That I think is the beauty of being selective with your chart choice. Because while some types of charts, right, can really hide variability, others really show it and embrace it, and then allows you as a reader to then think about other things that are going on.
And as a data visualization practitioner, it also helps you to work with your client in asking them these follow-up questions and probing, well, what is it about this data that you really want to share? So that’s the second way. So what I tell folks is be choosing when selecting a visualization type. And oftentimes, ask yourself, do you even want to visualize at all? So that’s the second type. The third type is something that’s, I would say, a little bit more controversial.
In the sort of information design and data visualization space, there’s a lot of controversial sort of conversations that go on about experimentation and artistic license. And contrary to popular belief, I actually really enjoy art within the context of data, and I do a fair amount of generative art. And
I love to experiment. I love to sort of play around with textures and shapes and allowing the data to help me in molding and creating new types of visualization types or using mathematics, right, or algorithms to create new visual forms. And so in the piece, I talk a little bit about this interesting quest.
if you will, of creative expression that oftentimes gets lost in translation when it comes to data visualization. And it’s oftentimes because, and I remember I was told this when I first entered into this space, that the goal of data visualization is again the simplification to make things easy. You need the sound bite. It needs to be this quick insight. And that’s something that a lot of data visualization practitioners take to heart.
And that then translates them into them not wanting to be more creative. It translates into them not wanting to express how they feel or how they’re experiencing a data set or data that are shared with them with the client. And because of that, artistic license and creative expression is this almost touchy subject, and I really wanted to speak to that in this piece because I think that
In some respects, data is art, and visualization can be art, and there’s nothing wrong with wanting to infuse art in that process. And so when it comes to artistic license, I think that there is a balance that can be struck with infusing your own creative expression with some of these.
best practices or science-informed processes that we’ve come to adopt as a scientific community around data visualization and information design. And I think that tension is only one that’s there because there is this vested interest in a way in controlling the narrative around what is considered data visualization. And oftentimes, you know,
When I’ve had this conversation with some of my colleagues, it’s because there’s a vested interest in deciding who can be a data visualization expert and who is not, right? Just by virtue of how they design, who some of their predecessors or mentors are in the field. And I just think that that’s a little crazy. I think that how we view the world today,
is very different from even 20 years ago in some of the multimedia tools that we have at our disposal that would have probably been considered, in some respects, art, just didn’t exist. so we need to be careful when we make these declarative statements about art and data visualization and how they don’t go hand in hand. And so to illuminate this point in the piece,
I quite literally go through this process where I’m sharing iterations of the same type of graph, just slightly different creative strokes that are being used to really represent the data and show how you can have a set of data and you can express it in just many different ways. And that’s beautiful, right? Because I think some folks.
really respond to that creative expression in specific spaces and in particular contexts in ways that other people wouldn’t. And I think that process is so beautiful and we shouldn’t shun or we shouldn’t shy away from wanting to infuse that into the process. And I do, if I’m remembering correctly, have a caveat in the actual piece where I say that I’m not saying that we all have to be more artistic.
in the way that we approach data visualization or even information design. But what I’m saying is that, you know, an artistic aesthetic isn’t bad and there’s nothing wrong with that. And that we should embrace visually representing data in different ways, because that’s like the spice like variety is the spice of life, right? Everyone is coming to a data set in a different way. And so I think that that’s something that should be celebrated.
Alexandra Mannerings (19:37)
I have on my workbook shelf over there a book that says data are beautiful. And that concept, right, I agree with you that we embrace and love this. There’s a woman named Ali Torban, who I adore in the data visualization space, and she did a self-contest once, or not a contest, like that she wanted to challenge herself. It was a challenge to see if every day she could make a different data visualization wallpaper pattern.
Right, with just again, this idea of celebrating the beauty that data really can be. And so I love that you bring that up as a form of oversimplification when we say, no, we must somehow remove the beauty and the art from this, that there is a loss there. I wanted to come back to something you said earlier on about the opportunity cost.
I think that phrasing was such an important element of all three of your different examples, which is you’re not saying, as you very astutely point out, that the best practice is never do this, right? That there’s not this set in stone rule that must always be followed, and if it’s this, you do this, and if it’s this, you do that. It’s saying you have to balance the cost of the choices you’re making
Dr. Ama Nyame-Mensah (20:31)
Yeah.
Alexandra Mannerings (20:48)
going to develop in understanding, in being able to communicate a certain set of information, in developing a more nuanced and informed approach or insight into a certain area. I was wondering if you could talk a little bit more about how we understand those opportunity costs, say specifically in chart selection. Let’s just pick chart selection for an example of this trade-off, like this concept of that trade-off, that opportunity cost.
Dr. Ama Nyame-Mensah (21:16)
So I have a somewhat like a mindset about this notion of knowing when to pick and choose, only because I have found in my own practice and in my own dealings with other folks in the field, it’s often something that isn’t talked about and it’s often something that folks choose to steer budding practitioners away from.
because they feel as though they need to get and memorize, if you will, the basics before they can then go on to break the rules. And I think there is something important to learning and nurturing a foundation in a field. But I also recognize that because that’s the sort of.
Entree that a lot of folks have to data visualization where you know, there’s a lot of stuff out there that Is very flow diagrammy and it shows you like if you have this data then you do this and if you have this many variables you do this and that type of Process thinking
we approach data visualization in a very rote way, it forces, well, I should say actually the opposite. It allows the practitioner to not have to think about a lot of those choices that they’re making and why they’re making it or even question the person who created the flow diagram or
the mentor who’s telling them this is the way that it’s always been done. And I think that has in effect created a very sterile, if you will, portrait of what data visualization can be. And so when people are exposed to something that is a little bit more creative and a little bit more artistic, that’s why they tend to have like a very visceral response to it as that’s not.
data visualization, that is not information design. And that’s definitely a problem because, as I said, tools that we have today that didn’t exist 10, 15 years ago would have been perceived as being creative and a little bit more artistic. And just think, if the person who created that tool hadn’t thought to sort of color outside the lines, hadn’t thought to be a little bit more creative in the way that they approached their practice, we would still be
you know, using the exact same tools and processes and practices, and then the field really becomes stale. And so when I think about creative expression and I think about design choices, they really go hand in hand because how do you know if something works unless you test it? And I think it’s the same thing when we think about science, like folks like to talk about science as though it’s this very binary thing. It is or it isn’t and no, it actually really isn’t. You don’t actually know something until you try it. But at the same token,
You can’t not say something doesn’t exist by virtue of not experiencing it, because it just means maybe you haven’t experienced it yet. And I think that gray area is something that we, as practitioners, just need to become more comfortable with as the field of data visualization continues to develop. And I think, you know, it also speaks to the fact that data visualization is a very young field. There’s still a lot out there that we just don’t know.
And increasingly, we’re finding a lot more folks are doing these types of experiments and learning more about how people are perceiving graphics and different types of data visualization types and what are the effects of those perceptions and how is that then as a feedback loop speaking to practitioners and influencing our design choices. And so I’m excited to see where a lot of that experimentation is going to lead, hopefully less sterile.
But you never know. And I think that when we do experiment, it also offers us an opportunity as practitioners to examine our own design choices. Because I think oftentimes when people think about experimentation, they’re like, oh, well, it’s for the audience. They didn’t respond to it to do something else, iterate again. And I always say, sure, right? Like some audience members are only going to respond to certain types of things, or maybe they only like circles. So don’t do a bar graph, right? But…
It’s also an opportunity for you as a practitioner to say, well, what do I like about this? How does this fit in line with what I’ve been taught? How does it maybe buck the trend? And is that good? How does that make me feel? Those are all important design choices and decision-making that I think create for more meaningful visualizations.
And in tandem, that also can help your audience uncover new knowledge, right? Because if you’re coming to this realization, you also have the opportunity to take your audience along with you and teach them how this new visualization type works and what makes it unique, right? Because even at one point, bar charts were new. And so we shouldn’t shy away from that type of experimentation.
Alexandra Mannerings (25:47)
I think back to Florence Nightingale’s visualization journey, right, and how she brought this whole concept of we can present information that is inaccessible to people not experiencing what was happening on the war front, you know, and what she was seeing. She said, I want people to understand the scale of what is happening, and it’s not what they think it is, right? The fact that disease is killing more people than the actual war itself, and I need to communicate that to an audience that just doesn’t get this.
invented ways of presenting it that had never been done before. Nobody had, it wasn’t like she went through, like you said, the decision tree and just flipped through the Rolodex and was like, oh, I have this data, I’m going to pick this chart and I’ll know how to present it. She had to invent a way of presenting that data from scratch. And they actually still have her sketches, right? And she iterated and tried different ways of presenting until she hit on a way that she really truly felt was compelling. And her need to do this was driven by just
She was so mad, right? So this idea of like this isn’t a sterile, you know, cold way we make these decisions. They really are driven by a need to convey something that is very important to what we’re doing, whether it be in health or in any other area. So I agree with you that approaching it instead of from a binary if this then this else that kind of approach and instead
the nuance of the opportunity cost, the art of the experimentation, of trying and of pushing boundaries and potentially failing with the visualization that you tried and you continue to tweak it. And I think being able to see more examples of those iterations of how charts develop is really important. You bring up such great ideas in terms of how we as data practitioners really can start to reframe the constructs and.
approaches that we bring to developing the visualization and a responsibility to examine how we are making those decisions. As consumers of data visualization, what suggestions do you have to support somebody who may not be making the choices around what visualizations are designed, say, in an organization, right? They get the annual report and those decisions have been made. But what could they, as consumers of data, potentially do to either support
this more nuanced approach to data visualization or, I don’t know, protect themselves against the dangers of oversimplification.
Dr. Ama Nyame-Mensah (28:05)
Oh, I have to shift my seat for this one. in fact, I would say this is where I tend to start with a lot of my own thinking. Because I think even as practitioners, you’re also a consumer, right? Because we’re constantly being inundated with all of these different types of graphics and visualization types and charts and best practices and everything else, right? And for me, the first thing that comes to mind is the fact that I’m a consumer.
is question everything. So I’m definitely one of those very annoying people. If you tell me something, I’m like, great, I’m going to ask you, you know, 20 more times just to see if you’re going to give me another answer. But I do that because I think it’s important to question how something’s being done, right? Why it’s being done. What was the thought process? And also selfishly as a practitioner, I’m always like, well, how can I tweak that process, right?
So definitely first off is to question everything. And the second thing I would say is to read the fine print because one of the things that I would say is becoming even more important as we’re being inundated with all of these graphics is the narrative piece because data don’t speak for themselves. And I am always very skeptical of pieces that are only visual in nature.
when it’s very clear that the audience either needs help being sort of toured around the piece or needs additional context to make sense of the piece. So I love to read the fine print. I love to read call-outs. I love to read notes. I love to read data sources to even go see the data for myself and play around with it. So second thing I always say is read the fine print. And a third and final but by no means I think
the least important on my list is, if something doesn’t make sense, honestly, just ask. So I know I get a lot, I’m sure, of interesting remarks from folks when I do sort of follow up or email and just ask like, well, what did you mean by this? Or could you maybe explain this a little bit further? Because I think it’s really important that if you don’t understand something, ask. Because nine times out of 10, there are probably…
12 other people who wanted to ask that same question and didn’t, and how silly that this is an important question that other people have and no one has chosen to ask it. So, follow up with the designer if their name is on it, ask them what they meant or ask them to explain or any sort of question. So those would be my sort of three go-to things about how to avoid and how to think about data visualizations a little bit more.
critically.
Alexandra Mannerings (30:36)
I find so often people are afraid to seek support in understanding something. I don’t know if in part it’s because they feel, oh, well, it just makes me look stupid, like clearly I’m supposed to understand this. And the fact that I didn’t, by reaching out for that support, it somehow makes me seem less smart. Or if they also sometimes feel like it’s, and this is where I love analytics made accessible, that they somehow feel this isn’t their space, that they have no right.
Dr. Ama Nyame-Mensah (31:03)
Mm.
Alexandra Mannerings (31:04)
then they’re not welcome there. And everything we can do to dispel both of those feelings, I think is critical as designers. And honestly, probably one of the problems is that there are some data practitioners out there who feel challenged by those kinds of questions. Like what, you think I didn’t do a good enough job on this and you don’t understand it? Well, that’s your problem. And I wish that we could make everyone understand that that’s on them, not on you asking the question, right? We as creators of data visualization
Dr. Ama Nyame-Mensah (31:20)
Yes.
Alexandra Mannerings (31:33)
question and inquiry. And in fact, if we have failed in some way to make something clear enough, then getting that feedback helps us and helps us tweak and refine and go, oh, you know what, you’re right. I reused those two colors and now it confused you because you think that they’re related. I need to fix that. Let me go change those colors or whatever it might be. Right. So I think that encouraging that just quest for understanding makes all of us better and makes the work better.
Dr. Ama Nyame-Mensah (32:00)
No, absolutely. And I think the one thing you said that I think you unlocked a memory for me being in higher education and in the academy where oftentimes like you’ll go to a talk. And there’s some folks who really responded well to questions. And there’s other folks who are like what you didn’t get that from the paper I wrote. And I think you know you’re right in this space. There’s often this air of arrogance where if you didn’t get it, there’s something wrong with you. And I was
err on the side of if they didn’t get it, how can I make it more accessible? Because I think oftentimes when it comes to different types of visualization types or chart types, even if it’s new or not, you always want to be thinking about how to make it more accessible to folks. And oftentimes, a lot of folks don’t actually care about that accessibility piece. And of course, we can define accessibility in different ways, right? But if a lot of folks are saying to you, like, I don’t…
get it, maybe think about, well, what is it about it that they’re having a hard time understanding and taking as you said that information in and improving upon your design and your process. But yeah, it’s definitely, definitely something that a lot of folks are not too pleased when they do get some of those questions. And I really hope that
begins to change in the field and people begin to ask those questions of practitioners and begin to take ownership right of these data, right? Because the data don’t belong necessarily just to the practitioner, especially since you’re wanting that interaction with the audience and you can’t get it if they don’t understand it.
Alexandra Mannerings (33:27)
How do we then balance the very real dangers that you have talked about in oversimplification and this need to present nuance and complexity and more information really in some ways, right? In order to preserve the integrity of that much broader underlying individual sets of data as we do aggregations and data visualization. But with balance that against the fact that
PhDs in data visualization, right? In fact, very few of us, I don’t, right? None of us have that, right? That we’re not all necessarily experts in this field, that we’re not all necessarily exposed to the same.
Dr. Ama Nyame-Mensah (33:56)
I was gonna say I don’t either, so…
Alexandra Mannerings (34:04)
even just like experience of ingesting different chart types or different kinds of data presentations. And in making that balance of accessibility and the expectation that we have of somebody being able to read and find their way through it, because we may not be able to actually sit there and walk them through it. And then this idea that there is a certain level of complexity that we want to maintain often, not always, but like often in how we present the data. And that feels like a tension that I’m just,
great answer for exploring that tension. So I’m gonna ask you it.
Dr. Ama Nyame-Mensah (34:35)
No, I think that’s a really great question. And I have to agree, I don’t necessarily have an answer. I think that one of the beauties of working with data and working with different types of media is that you can.
Alexandra Mannerings (34:40)
Yes.
Dr. Ama Nyame-Mensah (34:47)
choose a different type, a different medium that might allow you the flexibility of a little bit more complexity. And I think one of the greatest examples of this is the difference between static and interactive. And I think interactivity absolutely gets a lot of flak for being a little over the top, especially when we have something like a dashboard. But if used really
infusing elements of interactivity can allow you the flexibility of that complexity that oftentimes is quite literally flattened with the static visualization. And I think there are other types of ways that we can go about it as well. One of the big things right now that I’ve seen gain, I would say, a resurgence is storytelling. And I’ve seen it being woven in many different ways from
Oral stories being superimposed with data scrawly telling, being infused with videos and images. And it’s being done in a really thoughtful and beautiful way. And I like to think that is the result of experimentation and people recognizing that one sort of graph isn’t going to give you everything. And so
they took a step further and said, OK, here’s a dashboard, but then we need to orient the reader. So how can we orient them in a linear but non-linear way, right? Because oftentimes, stories can be linear, but they’re also non-linear because you might want to take them on a journey that’s not going from point A to point B. And so I think we can pick from different ways of telling and knowing and sense making. And I would say for me, that’s a good thing.
one way that I go about it. And there’s different ways of embedding elements of those processes in creating a visualization. But yeah, I don’t think I necessarily have a right or wrong answer to how it can be done. But I guess actually one other thing I would say as a third thing is not oversimplifying but taking a piece of
the larger story, and then to maybe stitching it together with other stories to create a larger narrative is something that I’ve also seen done quite powerfully. And that could be another avenue for wanting to tackle some of these more complex narratives and stories that we wanna weave together.
Alexandra Mannerings (36:56)
I really enjoy that you bring this holistic view to how we think about the data visualizations that we create. And I love that in your answer, there’s also the space that maybe one of the things we should do is stop thinking about how to get this bar chart right. And thinking about the fact that we’re holistically trying to convey a story, right? Not just this one data point. And that part of the solution can be that you don’t just present.
a chart in isolation and expect that somehow that poor bar chart can carry everything it needs to. But in fact, it needs to be supported by annotations and narrative and potentially multiple charts, right, to capture a spread of information. And I think that can be a trap that we do fall into as sometimes as creating data visualizations of this one chart must be perfect. And I’m going to think about just this one chart, and then I’ll move on to
also as consumers, right, that we should expect to consume a few different pieces, like you said, to read the fine print and to look at some different elements of the graph or potentially interact with it in order to deepen our own understandings of it. So that’s more of a more holistic approach to both creating and consuming data, I think, is a very powerful way to come at it.
Dr. Ama Nyame-Mensah (38:12)
No, it is. And as you were talking, it actually made me think of some of my own experiences. And I think the best way to describe it is going to like a museum, which is awful in many different ways. But one thing I think really successful museums do well is they immerse you in this experience. And oftentimes, right, you’ll maybe go and see an exhibit and then there’s a placard that accompanies the exhibit. Oftentimes, they’re sound, right?
There’s someone orating and maybe telling a story that goes with it. And I think when you infuse a lot of those traditions together, it can really create a masterful piece of storytelling that you just simply can’t get with a chart or a graph or just narrative on its own. But yeah, the example I’m thinking about is an experience I had at a museum, ironically, I think it was in London.
obvious reasons, with some of the curated pieces that they have, but the way that they curated the exhibit was very intentional and very thoughtful. And I like to think that way about my data experiences because I think for a lot of folks, data are only meant to be experienced in one dimensions or two dimensions. And I always say, why stop there? Why does it just have to be one thing?
I think even I remember a couple of years ago, I was having a conversation with someone and we were talking about, well, what is data visualization? And there were like charts and graphs. And I was like, hmm, does it have to be charts and graphs? Like data and visualization has two words, right? Of the whole, you’re just opening yourself up to so many possibilities. Like, why do you want to just limit yourself to charts and graphs? But that’s also just me.
Alexandra Mannerings (39:53)
what would you say data visualization is?
Dr. Ama Nyame-Mensah (39:55)
I don’t have a definition because I think, you know, I’m one of those folks that say data are, I’ve slipped several times I think, because I’ve talked and I say are and then I say is. You know, data can be anything. So why must it be one thing? And I think where we fall short is by only accepting the visual aspect and saying it must be graphic in nature. Right?
Alexandra Mannerings (40:00)
Yes.
Dr. Ama Nyame-Mensah (40:16)
And I think that’s also why I’m particularly partial to being called a data storyteller, because when we do say data visualization, it does evoke specific emotions, right? And connotations of it being a graph or a chart. When we say storyteller, you can tell stories in many different ways. You’re not limited to a specific type of medium or way of making sense of data. And that excites me.
Alexandra Mannerings (40:39)
I’ve that concept of data curation, right, to achieve what the best museums can. That is in many ways what we are in presenting the data because we’re having to make choices about what we surface and what we leave, right? They talk about museums have like 90% of their collection in the basements and only 10% are ever shown at any one time. Right? So you’re making choices about what gets shown and what doesn’t. Like you said, you’re making choices about the context and the narrative and how you explain it and how you present it. And that.
idea of the immersive experience, I remember going to the Holocaust Museum in DC, you know, in middle school, and that memory is so vivid for me because you were immersed in this experience, and that they were able to capture an experience and a phenomenon that spanned so many millions of people and dozens of different countries, and that you could experience it personally yourself in a way that made you
even begin to fathom what the Holocaust is made of. And that you could do that with data visualization, that you could somehow find a way to come at the story you’re trying to tell from different angles by not limiting yourself to just charts and graphs, right? Not limiting yourself in terms of the words that are surrounding that and finding ways to actually craft this immersive data experience.
I love that challenge as saying this is what we should strive for and that we should demand as consumers in addition to support as practitioners.
Dr. Ama Nyame-Mensah (42:04)
Mm-hmm. think museums are the best example that I can think of for that type of immersive experience you’re describing. And I think as well, when it comes to data and visualization or information design or data design, to me, it is about that emotion. And I think that often gets
washed away because folks are so caught up in wanting to express an objective truth. And I’m one of those folks where it’s like, I don’t necessarily believe in true or false. It’s just shades of grays. And as you said, right, and as we’ve talked about choices, right, because if we decide to sort of cut the data in a different way, we might come up with a different answer. You know, and I think that that’s an important element of the process that we need to talk about more.
in wanting to evoke emotion from our audience and wanting to take them on a journey.
Alexandra Mannerings (42:55)
Well, thank you so much for your time today. I really, really appreciate your incredible insights. I am very sure people will want to continue to engage with you and follow you. How can they connect with you, find you, learn more about you?
Dr. Ama Nyame-Mensah (43:06)
So I can be reached online of my website. is anyamemensah.com and I can be reached there. I can also be reached on socials like Twitter and LinkedIn. And my at is anyamemensah.
You can also just send me an email, and I’d be happy to provide that as well. I tend to actually forge a lot of my great sort of friendships with folks who just randomly reach out to me or I reach out to them that way. So I will respond to your email if you do send me one. I’m one of those folks that’s like, oh, yeah, it’s interesting, let’s talk about that. And so yeah, those are some of the
the venues where I can be reached.
Alexandra Mannerings (43:44)
Excellent. We’ll include all those links in the show notes too. So thank you again so much for your time today.
Alexandra Mannerings (43:49)
from Analytics Made Accessible. Please check out her links in the show notes below. She’s an incredible resource for so many different aspects of bringing your data story to life. And I hope that now maybe you will think a little bit more or in a different way about the story that you are trying to tell with your data rather than what the best chart type is or whether your colors are on brand. If you think about the emotion
that you are looking from your audience, the story and journey that you are hoping to take them on, and whether or not that journey is the most evocative and also the most informative. Does it help us understand new information or is it simply reinforcing stereotypes or unconscious assumptions that we already have? So let us know.
How might this change the visualizations that you reach for? How might it change the visualizations that you consume in your search to gain the data and information that you need on your journey? So thank you so much for joining us today. I hope that you had as much fun listening to her conversation and being challenged to question everything as I did. I do recommend you read her article. Again, the link’s below the article that led me to Ama in the first place because it really
brings so much of what we talked about and gives such great examples to the forefront of this discussion. I wish you joy and wonder on your data journey. And thank you so much for joining us today.
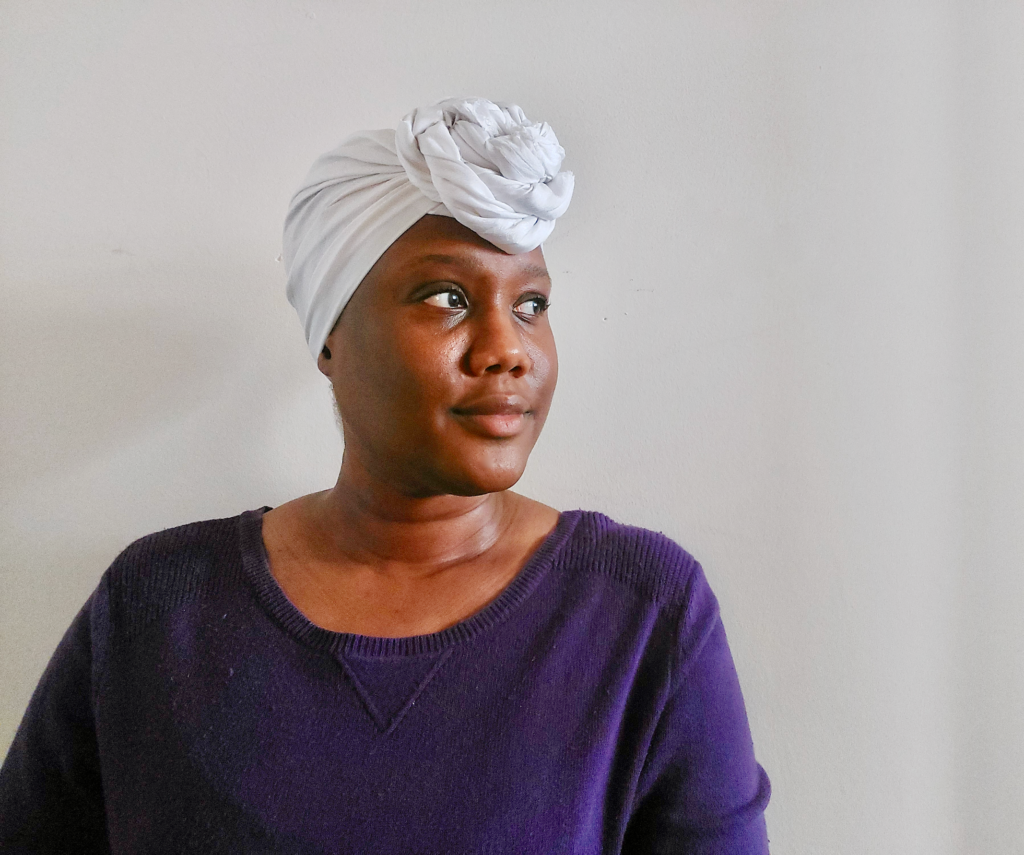
Dr. Ama Nyame-Mensah
Dr. Ama Nyame-Mensah is a data scientist and designer dedicated to making data science accessible and impactful. Through her practice, Analytics Made Accessible LLC, she provides practical data science training and consulting on data visualization. Dr. Nyame-Mensah is also a strong advocate of diversity and inclusion in the tech industry, providing strategies to address bias, enable inclusive environments, and accurately measure success through these initiative.
Comments are closed